Because I love statistics I made a thing that makes graphs of when people are online on Discord and what they are doing. It sounds kinda creepy and in fact it is (totally inspired by this).
Discord status
Everyone knows these little colorful dots, they exist in almost every chat application. But how exactly does it work on Discord?
To find out, there is only one solution, to go deep into Discord’s code. And to do that, just press F12 or CTRL+SHIFT+I in a browser or in the Discord client (since it uses Electron).
I’m in
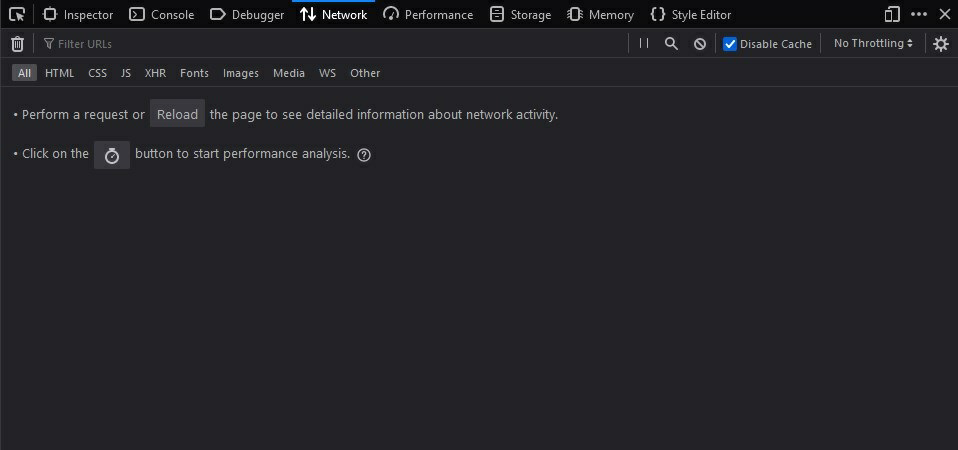
Ok now do CTRL+R to reload the thing and congrats the network tab is already full. You might be wondering, what are we looking for in this mess. I spare you the details, Discord uses something called Websocket for that sort of things. To see what the client and the server are talking about, we need to find the request for the Websocket. Rest assured, it is easy to find.
You can find it with:
- The HTTP status code 101, typically used when a websocket connection is established.
- The URL
gateway.discord.gg - The initiator
websocket
We have been bamboozled
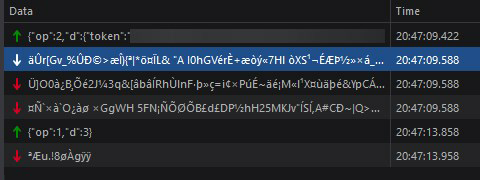
We can read the content of what we send but not what we receive. These two guys speak some weird computer language! I can’t use that for my beautiful graphs…
In fact, I decided later to decode the Discord desktop client version of these messages to copy the payload to act just like the regular client (except that I don’t encode my payload in ETF format). But this is an another story, let’s focus again.
Building a client from scratch
To see what on earth the server is sending to the client, I built a JavaScript websocket client with the WS library, with the help of my friend JunkMeal and with the help of the Discord documentation. Once again, I spare you the details of coding the whole thing. Let’s focus on the main topic: Spying our friends.
How can we see whenever or not a friend is online and what does he do? We learn here that the PRESENCE_UPDATE event is sent to the client when a user modifies his status/presence.
The thing is that I want to spy on only my friends and not the 35 624 187 users in the same servers as me.
To only spy on my friends, I first need my friends list. If you take a look here, you can see that Discord sends it to the client in the READY event. I just need to make a map with everyone from my friends list:
| |
Then, I can check if the user who modified his status/presence is in my friends list:
| |
It seems to be working, nice. This is an example of a log of an user, it contains the timestamp (time in seconds since the 1st January 1970) of the new presence, his status (online, idle, dnd, offline), the platforms on which he is connected (desktop, mobile, web) and his activities (playing, listening, …).
| |
Just add to that a piece of code to save them to a local database and we’re good to go. Now it’s time to aggregate data, and for that I’ll let the client run for a while.
Graphs time
Now that we have these creepy beautiful data, it is time to make some good looking graphs. For that I’m using a library called chart.js.
It took me about 5 times longer to make these graphics than it took me to write the websocket client code. I had strange problems like when it’s 23:00 and the graph shows only 75% of the data… In fact, I messed up the variables names but it took me 3 hours to realize it 😅.
Stop saying nonsense, show me good looking graphs
Remember that you asked for it, here they are:
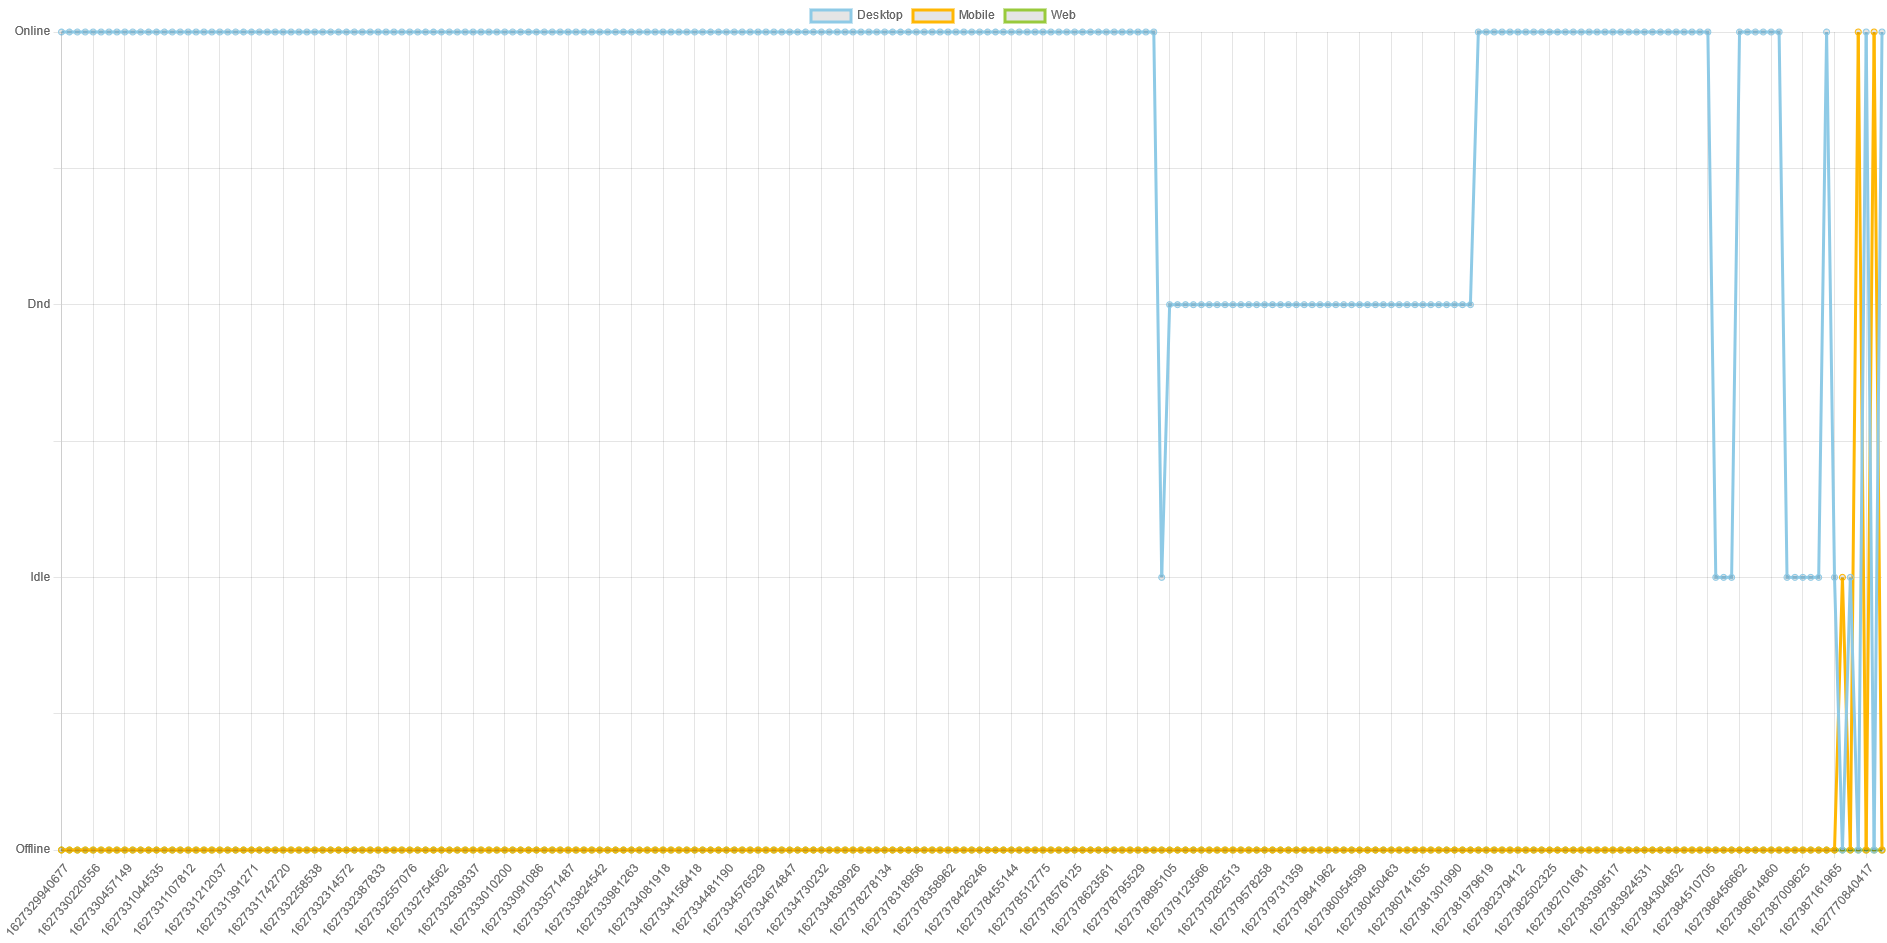
The x-axis is time, and the y-axis is the user status. Status for an user are “online”, “dnd”, “idle” and “offline”. Each coloured line is a different platform. It can be Desktop, Mobile or Web.
Can I prevent you from doing that to me?
Just unfriend me (please don’t, I will be alone without friends).
Conclusion
With these data and graphics, I can surely guess when you wake up and when you go to bed. Perhaps even when you are at home (desktop) and when you are outside (mobile). Yes it is scary, but keep in mind that Discord and all other companies from who you get an online service for free probably do the same thing.